GameCo - an excel project
A fictional video game company that is seeking to become a market leader in global video game sales. An analysis of GameCo’s video game data set will foster a better understanding of how they might fare in the global market.
Objective:
Perform a thorough analysis of GameCo’s sales data between 2006 and 2016 to develop a marketing plan to increase global sales by 2017.
Key Questions:
Are certain types of games more popular than others?
Have any games decreased or increased in popularity over time?
How have their sales figures varied between geographic regions over time?
Data and Tools used:
Data: data set covers historical sales of video games (for games that sold more than 10,000 copies) spanning different platforms, genres, and publishing studios. This data was drawn from the website VGChartz.
Tools: Micorsoft Excel
Facts:
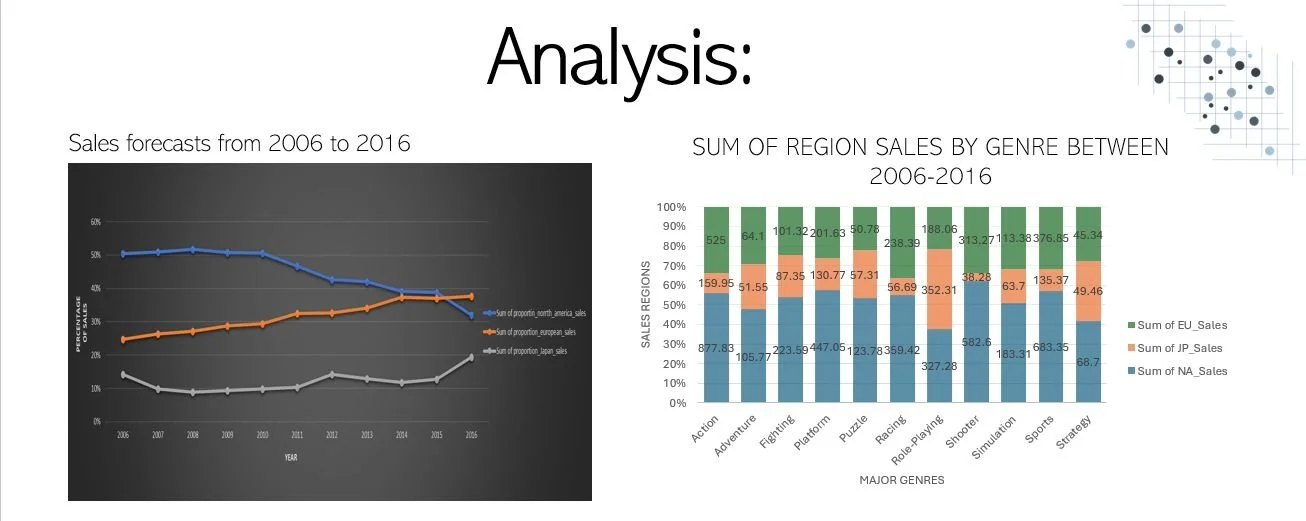
1. North American region sales declined almost 20% between 2010 and 2016
2. Japan region sales increased 5% between 2010 and 2016, but fluctuated during this period, although there were no losses recorded
3. Europe region sales saw steady and solid sales growth between 2006 and 2016
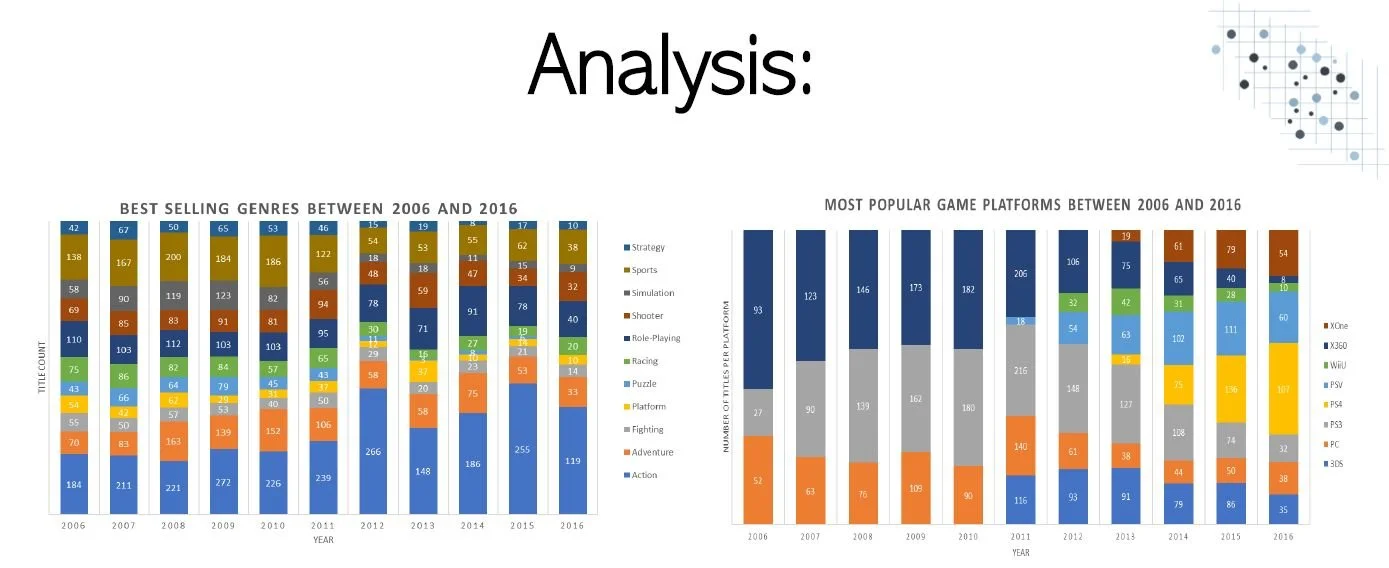
The top 4 selling Genres for GameCo between 2006 and 2016 were
(in no particular order):
Role-Playing
Action
Sports
Adventure
Takeaways and Recommendations:
Takeaways:
North America continues to be GameCo‘s strongest market in sales generated per year
Japan and Europe have shown consistent sales increases over 10 years
Europe has shown a steady increase in sales over the last 10 years
GameCo‘s four strongest genres are: Action, Sports, Role-Playing and Adventure
GameCo‘s three strongest game platforms are: Sony Playstation, Microsoft Xbox and PCs
Recommendations:
Renewed focus on the North American region to increase and recuperate the 20% lost sales between 2006 and 2016
Focus the next marketing campaign on GameCo’s four strongest genres and three strongest platforms
Look into which major sporting events will be on the global stage in 2017 and do a marketing tie-in
Allot a larger percentage of budget to the North America region to ensure sales increases in 2017
4. Although the decrease is certainly noticeable, the North American market continues to be the strongest market for GameCo
5. The decrease in sales for the North American market between 2010-2016 could be of some concern
6. North America surpasses sales of both Japan and Europe in all genres except one: Role-Playing
7. Japan leads sales in the Role-Playing genre by a slightly larger margin.
The top 3 selling platforms in our markets are:
Sony PlayStation
Microsoft Xbox
PC / Home Computer
Platforms not as popular but present in the market:
Nintendo (Wii and 3DS)
influenza season - A tableau project
The United States has an influenza season where more people than usual suffer from the flu. Hospitals and clinics provide the services necessary to tend to people who suffer from the flu. Sometimes they require extra staff. Medical staffing agencies provide this temporary staff.
Objective:
To help a medical staffing agency that provides temporary workers to clinics and hospitals on an as-needed basis. The analysis will help plan for influenza season, a time when additional staff are in high demand. The final results will examine trends in influenza and how they can be used to proactively plan for staffing needs across the country.
Key Questions:
Which states have the least/most quantity of “vulnerable populations” and have they been trending over a period of time?
Is the influenza season the same, time-wise, in all 50 states or are there variations according to region and climate? (for example: do Hawaii and Puerto Rico share the same timeline with Nevada and Arizona?)
Are there states that have suffered the same type of over/understaffing over the same periods of time, or have there been fluctuations year to year?
Which states have the least quantity of “vulnerable populations” and have they been trending over a period of time?
Has the under/overstaffing occurred similarly in the same states in different years or has there been a relationship between staffing trends vs actual staffing?
Data and Tools used:
Data:
Influenza deaths by geography. Source: CDC
Population data by geography, time, age, and gender. Source: US Census Bureau
Tools:
MS Excel
Tableau
ScreenPal

Conclusion and Recommendations:
Conclusion:
As shown in the visualizations, ALL states are affected by the influenza virus. Due to their population size, some states are more heavily affected than others. Due to these larger amounts of affected populace, special attention and focus needs to be placed on these particular states during the flu season. Within these populations, as mentioned before, there is one age group of people in particular that is most negatively affected by influenza: the elderly.
Recommendations:
1. Identify the vulnerable groups (ie. the elderly) in each state.
2. Coordinate with each state's health departments to establish prevention programs in areas most affected.
3. Coordinate with local pharmacies, doctors and healthcare centers to establish a vaccination drive for most affected.
4. Coordinate with federal, state and local governments for logistical support if needed.
5. Coordinate with medical frontline staff and administrators to ensure all appropriate staff and equipment is available when needed.
ROckbuster - an Sql Project
Rockbuster Stealth LLC is a movie rental company that used to have stores around the world. They are preparing for a new company strategy in 2020.
Objective:
Facing stiff competition from streaming services such as Netflix and Amazon Prime, the Rockbuster Stealth management team is planning to use its existing movie licenses to launch an online video rental service in order to stay competitive.
Key Questions:
Which movies contributed the most/least to revenue gain?
What was the average rental duration for all videos?
Which countries are Rockbuster customers based in?
Where are customers with a high lifetime value based?
Do sales figures vary between geographic regions?
Data and Tools used:
Data:
Rockbuster’s dataset which contains data such as film inventory, customers, and payments among other things.
Tools:
DbVisualizer
PostgreSQL
Tableau
Recommendations:
Added focus to see which specific genres are performing best per region
Look into opening up into the European and African markets
Offer incentives to customers to increase rental frequency
Look into age ranges of customers and tailor movie catalogue accordingly
Look into expanding streaming while maintaining physical presence in areas with difficulty getting online
Eliminate service in low performing areas and transfer resources into new markets (ie. Europe and Africa)
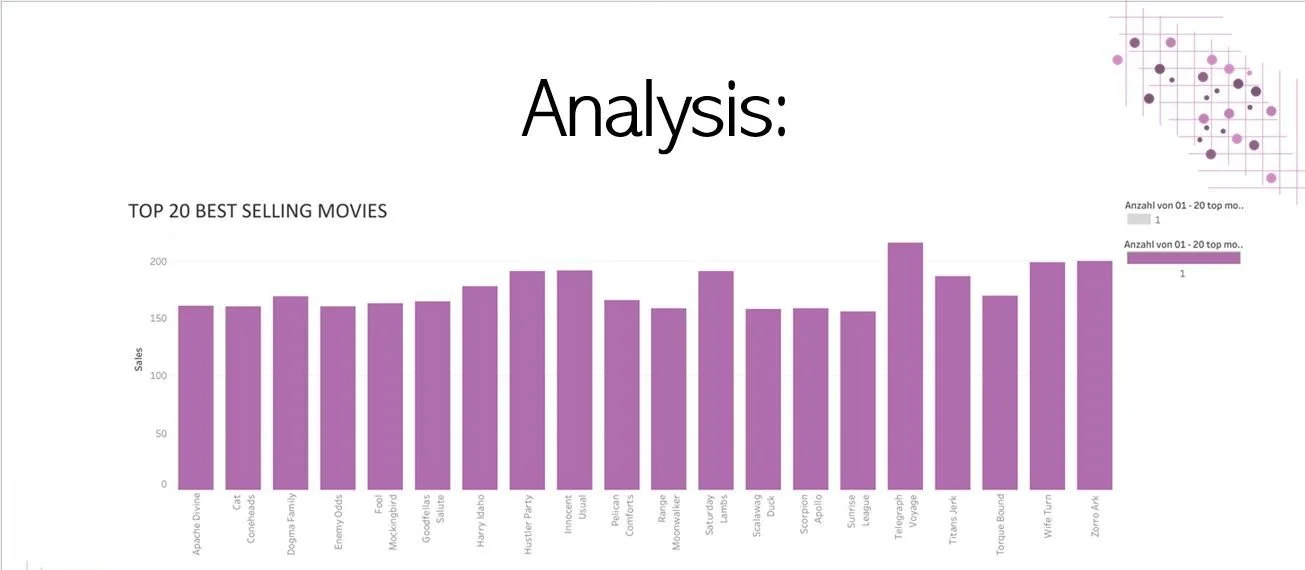
•These titles have proven to be Rockbuster’s “bread and butter” titles and should be heavily featured in the global launch
•Here we see that the movie “Telegraph Voyage” is the best-selling movie for Rockbuster
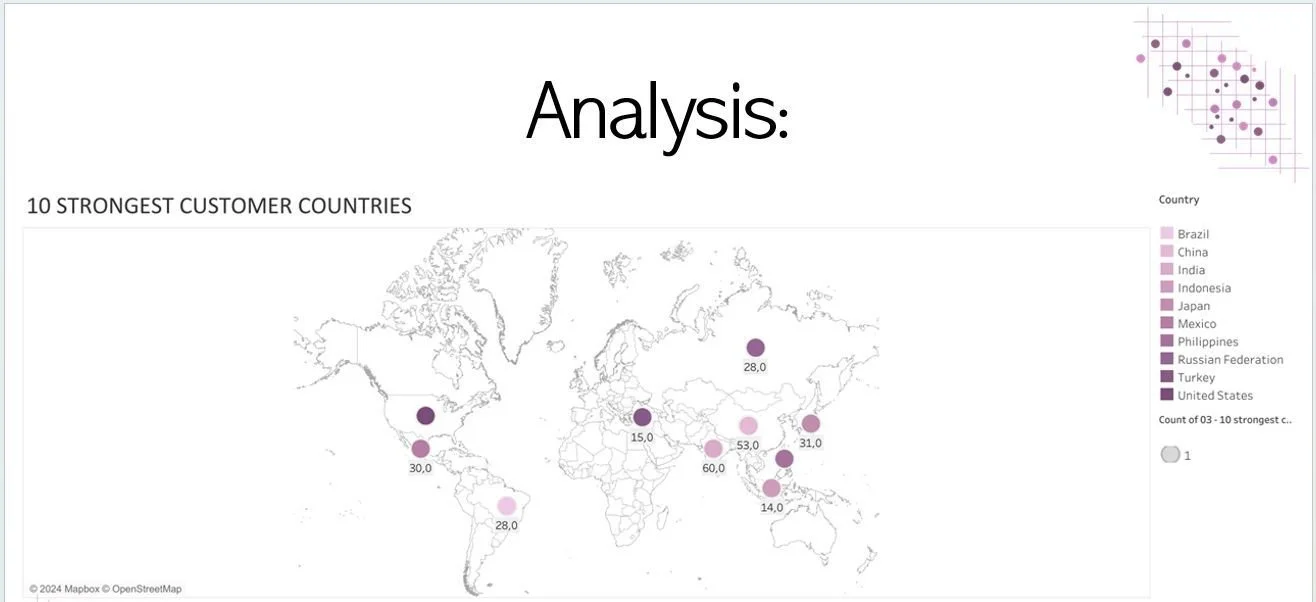
•The following 10 countries should be the main focal point in the 2024 digital launch
•Additional focus should be given to the Americas and Asia regions
•Further research should be conducted before entering the European and African markets
Instacart - a python project
An online grocery shopping company, Instacart wants to know more about their customers, how they can provide better services for their customers and how can they increase their profit
Objective:
Although Instacart already has very good sales, they want to uncover more information about their sales patterns and their customers. Via exploratory analysis, we will derive insights and suggest strategies for better client segmentation based on the provided criteria.
Key Questions:
The sales team needs to know what the busiest days of the week and hours of the day are (i.e., the days and times with the most orders) in order to schedule ads at times when there are fewer orders.
What’s the distribution among users in regards to their brand loyalty (i.e.,how often do they return to Instacart)?
Are there differences in ordering habits based on a customer’s region?
What different classifications does the demographic information suggest? Age? Income? Certain types of goods? Family status?
Data and Tools used:
Data:
“The Instacart Online Grocery Shopping Dataset 2017”, Accessed from www.instacart.com/datasets/grocery-shopping-2017 via Kaggle
Career Foundry Dataset
Tools:
Jupyter Notebooks
Python
MS Excel
Pandas
NumPy
Matplotlib
Seaborn
SciPy
Recommendations:
High ticket items: The presence of an increased number of high ticket items purchases in the morning indicate that a focused marketing campaign for "morning shoppers" could generate for Instacart an increased number of high ticket item sales. Historically, businessmen and young mothers are the type of clients that are up early in the morning and are able and capable of purchasing high ticket items in the morning...especially between the times of 5am and 8am.
Weekends: It is clear that Instacart generate most of their business over the weekend. It would be beneficial to create and promote a marketing campaign that will focus on "weekend essentials" products that could be marketed during specific seasons like summer, Christmas, Easter, 4th of July, Presidents' Day, Labor Day and Memorial Day. All these special dates are held during the weekend and it would be smart to target purchase campaigns with these themes during these weekends in order to maximize exposure and sales.
Consumer Research: A research team should be assembled to look into why sales are so low in the Northeast region of the US. The Northeast region is the original area of the initial 13 colonies and should actually be the one with the most positive purchasing habits...yet it is the one with the lowest. The Northeast region has the most concentrated population areas of the whole US and is the region that celebrates the most holidays in general. This must be investigated as to why sales are so low in this region in particular....especially since they are lower than the Midwest, and the Midwest is the region that is least populated in the US.
Parents: The largest purchasing group for Instacart are parents. This is a golden opportunity for cross marketing campaigns, especially during periods like "back to school" and/or school breaks like Easter, Christmas and summer vacation. Instacart could use its influence to target-sell parents across the US with specific product bundles that could be tailored according to season....hence seasonal targeting.
Loyalty: create a loyalty program which would offer discounts according to total price purchase and frequency of special ticket items purchased. Instacart could also create a program where cross items could be offered at a reduced price or even "free" when a loyal customer reaches a "purchasing milestone", for example. This could be used to intice these customers to increase their purchasing frequency.
Analysis:
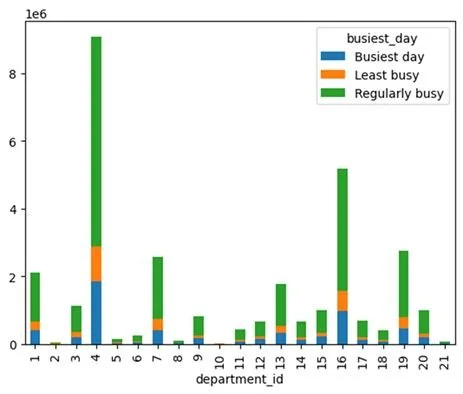
This graph shows which times of the day are busiest per department. We can see that certain departments are busier than others depending on the day/time of day.
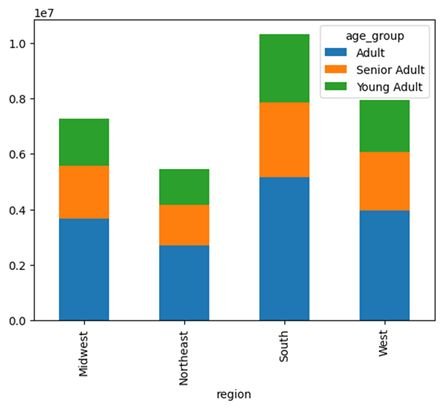
The graph above shows us the breakdown of our three largest shopping groups by age and region
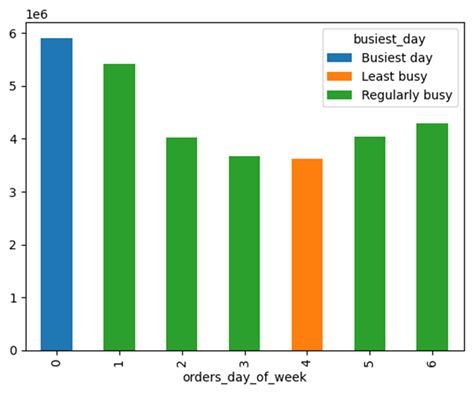
Here we can see the busiest (and least busiest) days of the week according to orders
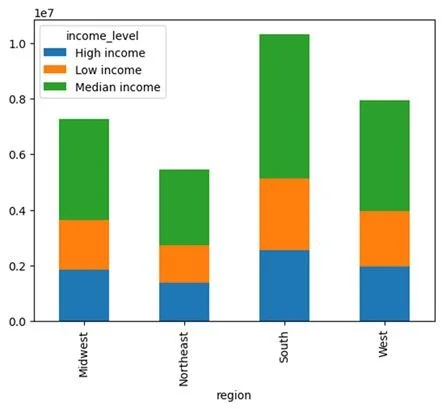
The graph above is showing us the breakdown between income and region. We can clearly see the breakdown between age, region and income in the two graphs above and we are able to get a real clear picture of the types of customers we have, where are they located, and how much income they possess.